Showing posts with label land grid. Show all posts

Wednesday, August 19, 2020

Why are there differences in my land grid?

There are many reasons for the differences between land grids. Some land grids do not come with everything included, while others have limited attributes. Furthermore, others have serious accuracy issues. Understanding these differences helps managing your assets within your AOI’s much easier. Section Township Range doesn’t really mean Section Township Range.

The truth is that most vendors do not provide the full land grid picture as part of their basic package. Layers like lots, quarters, and quarter quarters are considered premium offerings. Without these layers it makes mapping your assets much harder, especially when those assets refer to footage calls and legal descriptions.
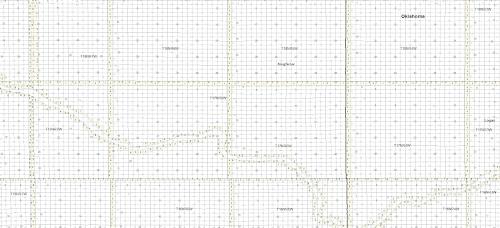

The full land picture analogy also applies to attributes. Without detailed and unique attributes, such as Section ID, Legal Description, it can be hard to auto map your assets. The same applies to the data model used by the vendor. Without an organized and consistent data model it can be hard to auto map your assets.

In the PLSS states (OK, CO, etc.) most, if not all, vendors use the same source, the USGS 1:24k topo maps. This makes it easy to compare accuracy and completeness when looking at land grid in these states. The only caveat is that the source (USGS 1:24k topo) is king, not necessarily the changes on the ground. An example would be as rivers move; the source may not have changed.

Now, Texas is a completely different kettle of fish. Most vendors use the Railroad Commission as the trusted source, especially for contested areas. However, the Tobin land grid does seem to match subsurface leases more closely, imagery more closely, and negates overlaps for a cleaner looking land grid. The reality is that Texas is a moving piece of art with many pieces to the puzzle. There are two sources. One is based off the days of metes and bounds from landmarks that can be very obscure. The other is footage calls from landmarks and survey markers. This results in real contested areas and overlaps.


Land grid can, and should be, a complex beast. That being said, understanding your sources and being able to check those sources is vital in winning that battle. Things like knowing that section township range grid also means lots, quarters and quarter quarters, will complete that picture. While having a solid and complete data model within the land grid will help you master your assets in your AOI’s much more easily. Land grid is a beast, but it can do magical things for you and your organization if it can give you that complete picture.

Saturday, October 20, 2012

Our GIS Catalog is stacked!


US Land Grid, Inc. (http://www.uslandgrid.com) has just made available for instant download our 2,700 GIS data product. Ready for instant download is the Texas and PLSS Land Grid, over 300 Tax Parcels, and countless counties of PDF maps. No more waiting for your different datasets, get one of the 2,700 GIS datasets or PDF maps that you need instantly and without any hassle.
Our land grid (http://www.uslandgrid.com/land.html) data has been ready for a few months now. Apart from offering multple datums at no charge, our data comes with the lots, the quarters and the surveys. We don’t separate layers that belong to the land grid, we give you everything. Without a doubt a largest live, ready to download, GIS dataset with over 1,100 products, our land grid data and texas survey data is the largest online GIS catalog for instant download.
Matching the vastness of land with tax parcels (sometimes referred to as surface parcels, parcels, or surface ownership) completes the picture between land allotment and land ownership. Tax parcels (http://www.uslandgrid.com/parcels.html) become the meat in the sandwich between the land grid and surface leases. With over 300 counties of tax parcels ready for download online, our tax parcel dataset is largely focused on oil and gas plays – and from that perspective is very complete.
A new introduction, US Land Grid PDF Maps (http://www.uslandgrid.com/pdfmaps.html) provide 42 inch x 42+ inch maps that are beautifully designed and perfect for printing on plotters. Large scale and high detail, these maps are perfect for those of us that don’t have or use mapping software, or if we just want to print a quick map that can be marked up for presentation purposes. Oklahoma PDF Land Grid Maps are now complete. Texas is under construction. Watch this space, as we complete other states.
Our oil and gas data data is taking some time. We are working towards proving another excellent dataset that is tied to an industry leading data model and povides the consistency and accuracy in data you expect from US Land Grid. We hope to have our oil and gas GIS data release in early 2013.
In total, this means we now have over 2,700 products ready for instant download now available at US Land Grid. This is a huge number! As we continue to grow we expect this number to reach 5,000+ product ready for immediately delivery to your mapping program or PDF viewer. As we grow are datasets and offerings, we will also be growing our formats and delivery methods. If there is a GIS dataset that you would like to see, please let us know and we will do our best to make it work for you and US Land Grid.
From a GIS and mapping perspective, we hope you enjoy the intant delivery and service that we provide at US Land Grid – your new online source for Oil and Gas Data! We never close, and we never disappoint! Our industry leading guarantee makes any customer happy every single time. Please stop by and say hello.

Sunday, October 14, 2012

PDF Land Maps


US Land Grid (www.uslandgrid.com) has released it's first set of PDF maps ready for instant download. The PDF land grid maps are high resoultion, with a set print resolution of 42 x 50+ inches. The current states include Texas, Oklahoma and Colorado - with display layers including section, township, quarters, abstract, block, survey, sub survey and lots. For more information - please go here -www.uslandgrid.com/pdfmaps.html.
The maps have been hand made and are ready to use - virtually printable in any format and size - but with a set resolution of 42 x 50+ inchs for ultimate results with plotters. By enabling 42 inch printing the PDF land grid maps produce high quality, great looking wall maps that can be marked up in accurate detail.
In the PLSS states these large PDF maps produce high detail section township range maps that include lots and surveys. Adding the nice looking cartography by layering the land grid are the major roads, cities and water areas.
In Texas, the PDF maps include high details representations of abstracts, blocks, surveys, sections and sub surveys. Once again, the major roads, cities and water areas layer the land grid.
The appearance of the maps make for perfect basemaps that can printed in large scale and used for presetation and analysis. The land grid on the maps is smooth but not overbearing. All labels and references are appropriately marked.
Please see example here - www.uslandgrid.com/pdfmaps/tx-map-1.html
 PDF Maps
PDF Maps
These ready to use maps are a great addition to anyone interested in using and studying land data in their area of interest. With no mapping sogtware required it makes it easy to everyone to have a clean looking and ready to print map for any situation or presentation.
Texas, Oklahoma and Colorado is now being posted to our catalog of instantly downloadable products. As per our other products, land grid - tax parcels - oil and gas wells - PDF maps, you get your downloads instantly when you use US Land Grid.
Thanks again to everyone's support - we will keep you tuned to our next gis data release.
Contact: US Land Grid, Inc.
http://www.uslandgrid.com/
Phone: (877) 870 8872
http://www.uslandgrid.com/contacts

Friday, September 28, 2012

Oklahoma Tax Parcels and Surface Ownership - All Counties


You now have a good source for the complete list of Oklahoma Tax Parcels and Surface Ownership data! At US Land Grid, each county of tax ownership data includes the polygon, and a set of attributes that include PIN, Owner Name and Property Value.

Oklahoma tax parcels are updated yearly.

As with all our data, and specifically what makes our GIS data so special, our surface ownership attributes follow the US Land Grid Data Model. This means that the attribute table follows and is populated by the same attirbutes you will find in our land grid data and our oil and gas wells - making it easier for you to work with all our datasets.

Our tax parcel data costs $250 for a one time purchase.

Surface Ownership / Tax Parcels GIS Data includes:

PID
GISPIN
Owner
Address
Legal
Acreage
Lot
Tract
Subdivision
Market Value
Date

Tax Parcel County List:

􀀸􀀶􀀃􀀯􀁄􀁑􀁇􀀃􀀪􀁕􀁌􀁇􀀏􀀃􀀬􀁑􀁆􀀑􀀃􀀐􀀃􀀲􀁑􀀃􀁗􀁋􀁈􀀃􀁖􀁋􀁈􀁏􀁉􀀃􀁏􀁌􀁖􀁗􀀃􀀐􀀃􀀓􀀚􀀒􀀔􀀔􀀒􀀕􀀓􀀔􀀕

State County Vintage State County Vintage State County Vintage

CO Larimer 2011 OK Cotton 2010 OK Pittsburg 2010
CO Rio Blanco 2011 OK Craig 2010 OK Pontotoc 2010
LA Ascension 2009 OK Creek 2010 OK Pottawatomie 2010
LA Bienville 2009 OK Custer 2010 OK Pushmataha 2010
LA Red River 2008 OK Delaware 2010 OK Roger Mills 2010
LA Sabine 2009 OK Dewey 2010 OK Rogers 2010
LA Saint James 2009 OK Ellis 2010 OK Seminole 2010
LA Terrebonne 2009 OK Garfield 2010 OK Sequoyah 2010
ND McKenzie 2010 OK Garvin 2010 OK Stephens 2010
NJ Union 2011 OK Grady 2010 OK Texas 2010
NM Chaves 2011 OK Grant 2010 OK Tillman 2010
NM Eddy 2011 OK Greer 2010 OK Tulsa 2010
OH Belmont 2012 OK Harmon 2010 OK Wagoner 2010
OH Carroll 2012 OK Harper 2010 OK Washington 2010
OH Coshocton 2012 OK Haskell 2010 OK Washita 2010
OH Harrison 2011 OK Hughes 2010 OK Woods 2010
OH Holmes 2012 OK Jackson 2010 OK Woodward 2010
OH Jefferson 2012 OK Jefferson 2010 PA Allegheny 2010
OH Licking 2012 OK Johnston 2010 PA Centre 2012
OH Mahoning 2010 OK Kay 2010 PA Clearfield 2012
OH Monroe 2012 OK Kingfisher 2010 PA Clinton 2012
OH Morgan 2012 OK Kiowa 2010 PA Delaware 2011
OH Muskingum 2012 OK Latimer 2010 PA Greene 2009
OH Noble 2012 OK Le Flore 2010 PA Lycoming 2012
OH Stark 2012 OK Lincoln 2010 PA Sullivan 2012
OH Tuscarawas 2012 OK Logan 2010 PA Tioga 2012
OH Washington 2012 OK Love 2010 PA Wyoming 2012
OH Wayne 2012 OK McClain 2010 TX Andrews 2010
OK Adair 2010 OK McCurtain 2010 TX Angelina 2010
OK Alfalfa 2010 OK McIntosh 2010 TX Aransas 2010
OK Atoka 2010 OK Major 2010 TX Atascosa 2010
OK Beaver 2010 OK Marshall 2010 TX Austin 2010
OK Beckham 2010 OK Mayes 2010 TX Bandera 2010
OK Blaine 2010 OK Murray 2010 TX Bastrop 2010
OK Bryan 2010 OK Muskogee 2010 TX Bee 2012
OK Caddo 2010 OK Noble 2010 TX Bell 2010
OK Canadian 2010 OK Nowata 2010 TX Bexar 2010
OK Carter 2010 OK Okfuskee 2010 TX Bosque 2010
OK Cherokee 2010 OK Oklahoma 2010 TX Brazoria 2012
OK Choctaw 2010 OK Okmulgee 2010 TX Brazos 2012
OK Cimarron 2010 OK Osage 2010 TX Brewster 2010
OK Cleveland 2010 OK Ottawa 2010 TX Brown 2010
OK Coal 2010 OK Pawnee 2010 TX Burnet 2010
OK Comanche 2010 OK Payne 2010 TX Caldwell 2010
TX Calhoun 2010 TX Kaufman 2010 TX Taylor 2010
TX Cameron 2010 TX Kendall 2010 TX Titus 2010
TX Chambers 2010 TX Kerr 2010 TX Tom Green 2010
TX Cherokee 2010 TX Kinney 2010 TX Travis 2010
TX Collin 2010 TX Kleberg 2010 TX Tyler 2010
TX Colorado 2010 TX Lamar 2010 TX Upshur 2010
TX Comal 2010 TX Lamb 2010 TX Upton 2011
TX Comanche 2010 TX Lampasas 2010 TX Uvalde 2010
TX Cooke 2010 TX La Salle 2012 TX Val Verde 2010
TX Coryell 2010 TX Lavaca 2010 TX Victoria 2010
TX Dallas 2008 TX Lee 2010 TX Walker 2011
TX Deaf Smith 2012 TX Liberty 2010 TX Waller 2010
TX Delta 2010 TX Llano 2010 TX Ward 2012
TX Denton 2010 TX Lubbock 2010 TX Washington 2010
TX DeWitt 2010 TX McLennan 2010 TX Webb 2012
TX Dimmit 2012 TX McMullen 2011 TX Wichita 2010
TX Duval 2010 TX Madison 2010 TX Williamson 2010
TX Ector 2010 TX Maverick 2012 TX Wilson 2011
TX Edwards 2010 TX Midland 2010 TX Wise 2010
TX Ellis 2010 TX Milam 2010 WV Barbour 2011
TX El Paso 2010 TX Montague 2010 WV Boone 2011
TX Erath 2010 TX Montgomery 2010 WV Braxton 2011
TX Falls 2009 TX Newton 2012 WV Brooke 2011
TX Fayette 2010 TX Nueces 2010 WV Cabell 2011
TX Floyd 2010 TX Orange 2010 WV Clay 2011
TX Fort Bend 2009 TX Palo Pinto 2010 WV Doddridge 2011
TX Freestone 2012 TX Panola 2012 WV Fayette 2011
TX Gaines 2010 TX Parker 2010 WV Gilmer 2011
TX Galveston 2010 TX Potter 2010 WV Hampshire 2011
TX Gillespie 2010 TX Rains 2010 WV Hancock 2011
TX Grayson 2010 TX Randall 2010 WV Harrison 2011
TX Gregg 2012 TX Reagan 2011 WV Kanawha 2011
TX Guadalupe 2010 TX Refugio 2010 WV Lewis 2011
TX Hale 2010 TX Robertson 2012 WV Lincoln 2011
TX Hamilton 2010 TX Rockwall 2010 WV Logan 2011
TX Hardin 2010 TX Rusk 2012 WV McDowell 2011
TX Harris 2010 TX Sabine 2010 WV Marion 2011
TX Harrison 2010 TX San Augustine 2010 WV Marshall 2011
TX Hidalgo 2010 TX San Jacinto 2010 WV Mineral 2011
TX Hill 2010 TX San Patricio 2010 WV Mingo 2011
TX Hockley 2010 TX Scurry 2010 WV Monongalia 2011
TX Hood 2010 TX Shelby 2010 WV Morgan 2011
TX Howard 2010 TX Smith 2010 WV Nicholas 2011
TX Hunt 2011 TX Somervell 2010 WV Preston 2011
TX Jasper 2012 TX Sutton 2010 WV Putnam 2011
TX Jefferson 2010 TX Swisher 2011 WV Raleigh 2011
TX Johnson 2010 TX Tarrant 2010 WV Randolph 2011

State County Vintage WV Summers 2011 WV Taylor 2011 WV Tucker 2011 WV Upshur 2011 WV Webster 2011 WV Wetzel 2011 WV Wyoming 2011 WY Albany 2009 WY Goshen 2011 WY Laramie 2012 WY Sweetwater 2010 WY Uinta 2011 WY Weston 2011

Saturday, August 18, 2012

GIS data based on an Oil & Gas Data model

Creating GIS data based on a standard data model across the spectrum of data offerings is a challenging job. Over the last few months we, at US Land Grid, have been working hard to produce a standard data model for our GIS datasets. This means that our landgrid, our Texas Survey data, our tax parcels or surface ownership data, and our Oil and Gas wells all inherently belong to that standard data model. This is going to make it easier for you, the GIS consumer, to use and relate our data within just your software platform, or multiple GIS / mapping platforms. 


Providing useful GIS data that is easy to use and manipulate - without having to rework the data - is important to us at US Land Grid. The data we provide has been built by Oil and Gas professionals who understand the data models and needs of organizations that want accurate on-demand data.
We also believe that land grid is just that - land grid. We provide the full story of the land. This includes sections, townships, quarters, surveys, lots, abstracts, blocks, surveys and sub-surveys. In Texas, you get the comprehensive Texas land survey. In the PLSS states, you get the comprehensive public and blm land survey. We don't leave any GIS data out - especially when you look at our Texas Survey our our section township range data.
The same goes for our Tax Parcels and Surface Ownership data. It's based on the same data model allowing for easy integration and relational abilities. Currrently, we have 300+ county tax parcels, focused on Oil and Gas producing areas. One last point... we get our Tax Parcel data directly from each county assessor helps us rest easy that you will enjoy the quality and updates provided with our Surface OWnership GIS Data.
Our Oil and Gas wells are taking some time as we confirm to the standards of our multiple data GIS data model. Each state provides US Land Grid the well data, permit data and production data in different formats and different data models. This makes it challenging for us, but easpecially for GIS professionals who are trying to make the data work within organizations. Our Oil and Gas wells will be ready for release before year end, but they will be complete with consistency across our other datasets, with a full menu of attributes from completion dates to directionals. We excited to bring this special GIS dataset to you, and we think it will be enjoyed by oil and gas GIS professionals US wide.
It's hard not to focus on our data... I think one of the things that makes US Land Grid different from the others is price, and the fact that the data is delivered immediately. If you need to speak to someone you can, but you don't need to. You can buy the GIS data (which is affordable) and download it within seconds. For the oil and gas community, it's the first services focused on them that provides anything similar to this.
The story doesn't end there. Within the next twelve months you will see new offerings, both paid and complimentary, coming from US Land Grid.
The focus will remain - complete - easy to use - updated - GIS data.

Saturday, July 21, 2012

US Land Grid - Section Township Range


US Land Grid (http://www.uslandgrid.com) launched last week.  Our company provides section, township, range data, Texas survey data, PLSS, Oil & Gas Wells, free Web Mapping Services and other GIS datasets.

The GIS data on US Land Grid is based on trusted industry sources. It is available for instant download in multiple formats and projections. This includes shapefiles. Another unique twist is that we store data backups for you to download at a later date.  We also provide over 400+ Tax Parcels (ownership) with tax roll information and polgyons.

For more information - http://www.uslandgrid.com/blog.

Please enjoy a brief history of land and how it was formed below:

The Continental Congress was deeply in debt following the Declaration of Independence. Land grants were formed in areas similar to Texas and California in order to solve the situation.

The first step in opening land was to survey the entire area to be disposed of and assign a description to identify each parcel of land to be sold. The intent of the survey was to place the land that was being disposed of on a large grid with every square of the grid being individually identified. The numbers start from the intersection of the Meridian and Base lines. Those sections North or South along the Meridian are known as Townships and those along the East and West of the Base line are called Ranges. Combining the Township square number with the Range square number gives a precise location of any square on the grid. The grid below is an example of how the Sections within a Township are numbered. The black numbers are the sections within the township and the red numbers are the sections in the adjoining townships. As counties were formed from existing counties the county lines normally followed the section or township lines.

The PLSS was completed by the establishment of township and range lines. The General Land Office shows the theoretical sectioning of a standard survey township. Eighty chains constitute one U. They are the legally binding markers used for setting property lines and as such are the culminating work of any survey. Witness objects allow subsequent surveyors and landowners to find the original corner monument location should the actual monument itself be destroyed.

It was not uncommon for squatters or homesteaders to destroy corner monuments if they felt the patenting of the land would threaten their residence on it. Trees could be used if the corner happened to fall at the exact spot where one grew. The purpose was simply to help retrace a surveyed line should that become necessary. Ten square miles of land on each side of the proposed rail track were granted for every one mile of completed railway.

The Public Land Survey System was utilized for measurement. Each odd numbered section going to the railroad company. Each even numbered section kept by the government. This created a checkerboard pattern along proposed rail way. The system was devised by Senator Stephen A. The remote nature of the land being surveyed certainly enabled the opportunity for fraud to occur in the direction that water drains.

PLSS rules of division are explained below. Today permanent monuments are usually inscribed tablets set on iron rods or in concrete. This line is perpendicular to the Principal Meridian. Further information on these irregular surveys can be found in the references listed at the end of this article. These lots frequently border water areas excluded from the PLSS. These lands were never part of the original public domain and were not subject to subdivision by the PLSS. Sometimes used interchangeably with Public lands. It is grid which overlays a map and within the grid are the sections which are between a specific township and range. You can find this from the tax parcel identification number.The ranges run horizontally along the map and the townships run vertically along the map. The returned position is for the center of the section.

Note that some meridians are quite small. The California BLM has a nice set of maps showing the Principal Meridians and Base Lines and the areas they cover. It does not include the east coast states including Kentucky and Tennessee or Texas. Small areas of other states that were settled before the survey also technically excluded. This explains the odd shapes of many mining claims in the west. Latter title transfers followed PLSS lines.

Actually it is more correct to say that the states were formed according to the areas covered by the Meridians. Some of these areas include several large states while others include only a small part of a single state. Some of the smaller areas were caused by changes in tribal reservations. These are called standard parallels. The position of the base line for each principal meridian is also historical and arbitrary. Others are altered by simple survey errors.